


Dr. Randal Olson rebuilt his optimized 49-landmark U.S. route for 2026 — and while the destinations held steady, the price of reaching them has not.
While most road-trip fantasies involve open highways and spontaneous detours, the math behind them has gotten considerably uglier. Fuel for Dr. Randal Olson’s optimized U.S. Landmarks route — a 13,949-mile loop hitting 49 destinations across the lower 48 states and Washington, D.C. — ran about $1,300 in 2015, when the national average sat near $2.37 per gallon, according to published estimates. Today, with AAA reporting a national average of approximately $4.28 per gallon as of October 20, 2026, that same loop costs roughly $2,350 to fuel. That $1,050 increase — an 81% jump — reflects a decade of price pressure, not a longer drive.
Olson’s routes offer one of the clearest benchmarks available for long-distance road-trip planning: the destinations are fixed, so the only meaningful variable is what travelers are paying to reach them. Foliage season pulls people toward scenic highways and national parks, making autumn a natural moment to pressure-test a trip budget before committing to one.
The Route, the Math, and Where It Hurts Most
California’s roughly 860 miles at $6.14 per gallon make it the route’s most punishing stretch — and the state-by-state numbers get specific from there.
Olson’s landmarks loop — covering stops like the Rock & Roll Hall of Fame, the Alamo, and the Ben & Jerry’s Factory — runs approximately 224 hours of modeled driving time, excluding stops. The published fuel estimate assumes a specific vehicle fuel economy; actual costs will vary. The calculation itself is straightforward: miles driven divided by miles per gallon, multiplied by the local price per gallon.
State-by-state breakdowns matter more than the national average alone, according to reporting on the route’s fuel costs:
- California: ~860 miles at $6.14/gallon — highest prices in the dataset, significant mileage
- Montana: ~960 miles at $4.46/gallon — the longest reported individual state segment
- Texas: ~870 miles at $3.78/gallon — high mileage, below-average price
- North Carolina: ~80 miles at $3.59/gallon — one of the least expensive states, but barely 80 miles of route exposure
Where the route spends its miles affects the total as much as any single pump price. A state with relatively cheap gas contributes little savings if the itinerary barely crosses its border — while a high-price state with hundreds of route miles can reshape the entire budget.
The National Parks Alternative — and the Real Total Cost
At 16,103 miles and an estimated $2,710 in fuel, Olson’s second 2026 route is longer, wilder, and equally unforgiving on the wallet.
Olson’s 2026 national parks loop visits all 51 parks in the lower 48 states, covering approximately 16,103 miles and 270 hours of modeled driving, according to Olson’s official route announcement. At six hours of driving per day, that works out to roughly 45 driving days — before a single hike, meal, or rest stop is added to the schedule.
Fuel, though, is only one line item. Lodging, meals, park entrance fees, tolls, and emergency costs are not included in Olson’s estimate, and they can substantially exceed the gasoline bill on a multi-week trip.
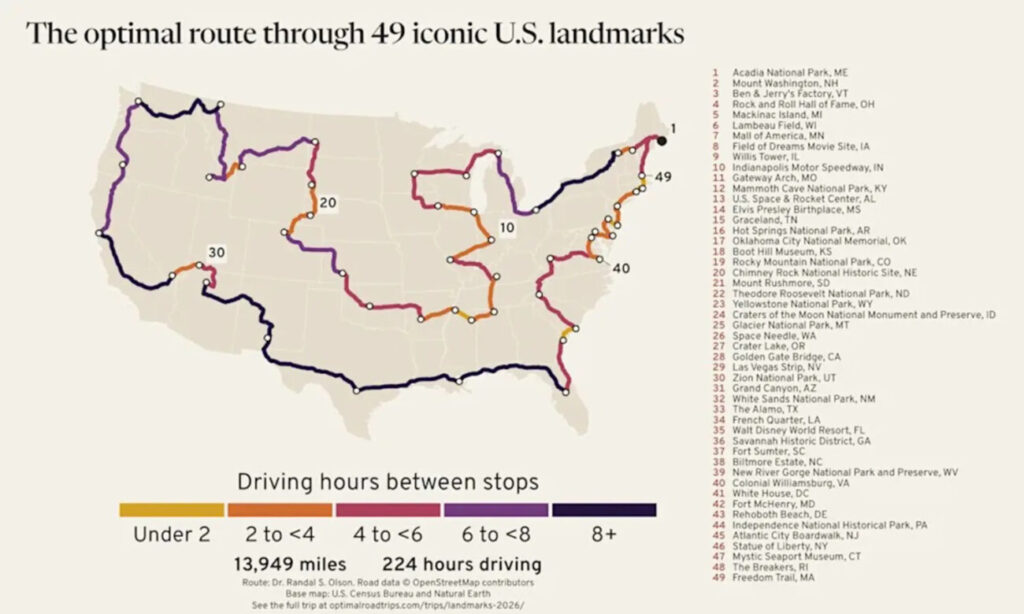
The practical upside: Olson’s interactive maps allow travelers to build a customized version of either route. Skip landmarks, shrink the loop, or add regional stops along the way. The full routes are frameworks, not requirements.
Calculating a realistic fuel budget means using your own vehicle’s MPG rather than assuming the published figure applies universally. Checking state averages before crossing state lines can also help — though detouring solely for cheaper fuel rarely saves money once the extra miles are counted. Build a budget that accounts for everything beyond gasoline, and the open road becomes considerably less surprising.